This page was created by the Report Generator tool,
a part of the Web Polygraph
performance benchmark.
1. Executive summary
| Throughput: | 249.49 | rep/sec |
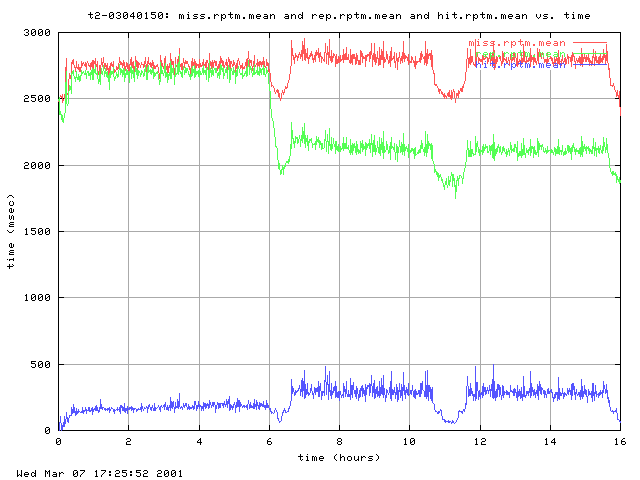
| Response time: | 2306.34 | msec |
| - misses: | 2769.08 | msec |
| - hits: | 275.86 | msec |
| Hit Ratio: | 17.81 | % |
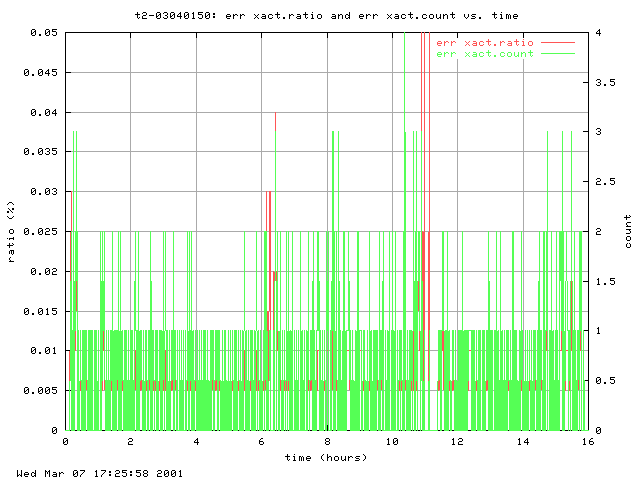
| Errors: | 0.00 | % |
| Duration: | 15.93 | hour |
Phases: framp|fill|fexit|inc1|top1|dec1|idle|inc2|top2|dec2
2. Engineer summary
1.00 logs
were used to generate this report.
| Load |
Count
(xact/sec) |
Volume
(MBits/sec) |
| Offered: |
249.49 |
21.18 |
| Measured: |
249.49 |
21.18 |
| Hit Ratios |
DHR
(%) |
BHR
(%) |
| Offered: |
37.09 |
38.72 |
| Measured: |
17.81 |
8.41 |
| Cachability Ratios |
Count
(%) |
Volume
(%) |
| Measured: |
80.03 |
83.44 |
| Response Times |
Response Time (msec) |
| Min |
Median |
Mean |
Max |
| hit |
1.00 |
170.00 |
275.86 |
6132.00 |
| miss |
3.00 |
2747.50 |
2769.08 |
92202.00 |
| ims.sc200 |
1.00 |
2243.50 |
2099.57 |
30129.00 |
| ims.sc304 |
4.00 |
2707.50 |
2731.16 |
8306.00 |
| cachable |
1.00 |
|
2236.37 |
92202.00 |
| uncachable |
3.00 |
|
2680.77 |
42880.00 |
| fill |
4.00 |
|
2797.42 |
92202.00 |
| basic |
1.00 |
2459.50 |
2325.10 |
92202.00 |
| ims |
1.00 |
2259.50 |
2114.57 |
30129.00 |
| reload |
4.00 |
2619.50 |
2629.93 |
17373.00 |
| rep |
1.00 |
2439.50 |
2306.34 |
92202.00 |
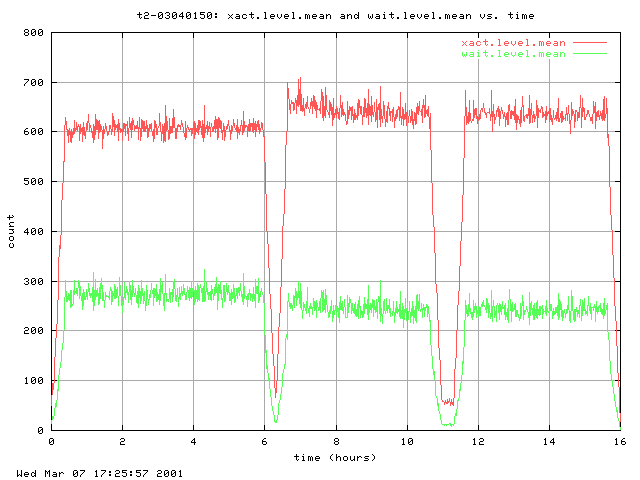
| Wait Queue |
requests |
| Enqueued: | 6089571.00 |
| Dequeued: | 6089585.00 |
| Average length: | 242.21 |
| Stream Rates |
Count
(rep/sec) |
Volume
(MB/sec) |
| hit |
44.43 |
1.78 |
| miss |
205.06 |
19.40 |
| ims.sc200 |
34.02 |
2.88 |
| ims.sc304 |
0.83 |
0.00 |
| cachable |
199.67 |
17.67 |
| uncachable |
49.82 |
3.51 |
| fill |
128.14 |
13.18 |
| basic |
205.93 |
17.56 |
| ims |
34.85 |
2.88 |
| reload |
8.71 |
0.74 |
| rep |
249.49 |
21.18 |
| Stream Totals |
Count
(rep*106) |
Volume
(GByte) |
| hit |
2.10 |
10.34 |
| miss |
9.71 |
112.63 |
| ims.sc200 |
1.95 |
20.15 |
| ims.sc304 |
0.05 |
0.00 |
| cachable |
9.45 |
102.61 |
| uncachable |
2.36 |
20.36 |
| fill |
7.35 |
92.27 |
| basic |
11.81 |
122.97 |
| ims |
2.00 |
20.15 |
| reload |
0.50 |
5.18 |
| rep |
14.31 |
148.30 |
| Connection Length |
Min |
Mean |
Max |
| Use (xact/conn) |
1.00 |
1.00 |
1.00 |
| Life time (msec) |
1.00 |
2306.34 |
92202.00 |
| Object Sizes |
Size (KB) |
| Min |
Median |
Mean |
Max |
| hit |
1.26 |
4.27 |
5.15 |
44.18 |
| miss |
0.38 |
5.70 |
12.17 |
7011.56 |
| ims.sc200 |
0.38 |
5.19 |
10.83 |
7011.56 |
| ims.sc304 |
0.10 |
0.10 |
0.10 |
0.10 |
| cachable |
1.25 |
|
11.38 |
4641.71 |
| uncachable |
0.38 |
|
9.05 |
7011.56 |
| fill |
1.25 |
|
13.16 |
4641.71 |
| basic |
0.38 |
5.23 |
10.92 |
7011.56 |
| ims |
0.10 |
4.99 |
10.57 |
7011.56 |
| reload |
0.39 |
5.21 |
10.87 |
3062.55 |
| rep |
0.10 |
5.19 |
10.87 |
7011.56 |
| Object Class |
Contribution (%) |
| Count |
Volume |
| hit |
17.81 |
8.41 |
| miss |
82.19 |
91.59 |
| ims.sc200 |
13.64 |
13.59 |
| ims.sc304 |
0.33 |
0.00 |
| cachable |
80.03 |
83.44 |
| uncachable |
19.97 |
16.56 |
| fill |
51.36 |
62.22 |
| basic |
82.54 |
82.92 |
| ims |
13.97 |
13.59 |
| reload |
3.49 |
3.49 |
| rep |
100.00 |
100.00 |
Errors (0.00% of all transactions):
#errno  count count% explanation
   263    158  30.50 "premature end of msg body"
   267    237  45.75 "unsupported HTTP status code"
   276    123  23.75 "hit on reload request"
Potential problems:
- Measured document hit ratio (17.81%) differs
from the offered DHR (37.09%)
by -51.98%.
- Measured byte hit ratio (8.41%) differs
from the offered BHR (38.72%)
by -78.28%.
- Reported fill count contribution (51.36%)
does not match `cachable miss' estimation (62.22%).
- Reported fill volume contribution (62.22%)
does not match `cachable miss' estimation (75.03%).
- ... where A differs from B by X% means X = 100*(A-B)/B.
3. Traces


Generated on Wed Mar 7 17:25:58 2001 by ./make_report t2-03040150