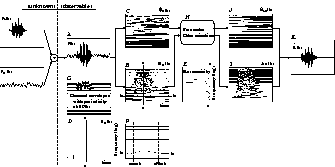
Fig. 5 shows an overview of signal processing of the proposed model.
First, the noisy vowel /a/ f(t) shown in Fig. 5 A (the SNR of f(t)is 10 dB) is decomposed into Sk(t) and ![]() as shown in Figs. 5 B and C, respectively.
Next, F0(t) is estimated as shown in Fig. 5 D.
The concurrent time-frequency region of the desired signal f1(t) is determined using constraints (i), (iii), and (iv-b) as shown in Figs. 5 E, F, and G.
Finally, the instantaneous amplitudes and the instantaneous phases of the two signals are determined from Sk(t) and
as shown in Figs. 5 B and C, respectively.
Next, F0(t) is estimated as shown in Fig. 5 D.
The concurrent time-frequency region of the desired signal f1(t) is determined using constraints (i), (iii), and (iv-b) as shown in Figs. 5 E, F, and G.
Finally, the instantaneous amplitudes and the instantaneous phases of the two signals are determined from Sk(t) and ![]() using constraints (ii) and (iv-a).
The determined Ak(t) and
using constraints (ii) and (iv-a).
The determined Ak(t) and
![]() are shown in Figs. 5 I and J, respectively.
The segregated signal
are shown in Figs. 5 I and J, respectively.
The segregated signal
![]() is shown in Fig. 5 K.
In this figure, the segregated Bk(t),
is shown in Fig. 5 K.
In this figure, the segregated Bk(t),
![]() ,
and
,
and
![]() are omitted.
are omitted.